
This manual describes the older version.
For the current version (version 3.0.xx or higher), see “Home“.
*This article was created when Ver. 2.0.0 was released.
(Last update: Ver 2.0.7.1)

It is divided into three tabs: “Real Time,” “Overview” and “Sessions & Heatmaps (formerly known as “Find the Heatmap You Want to See”).
◆Real time
You can see the real-time status of the site.
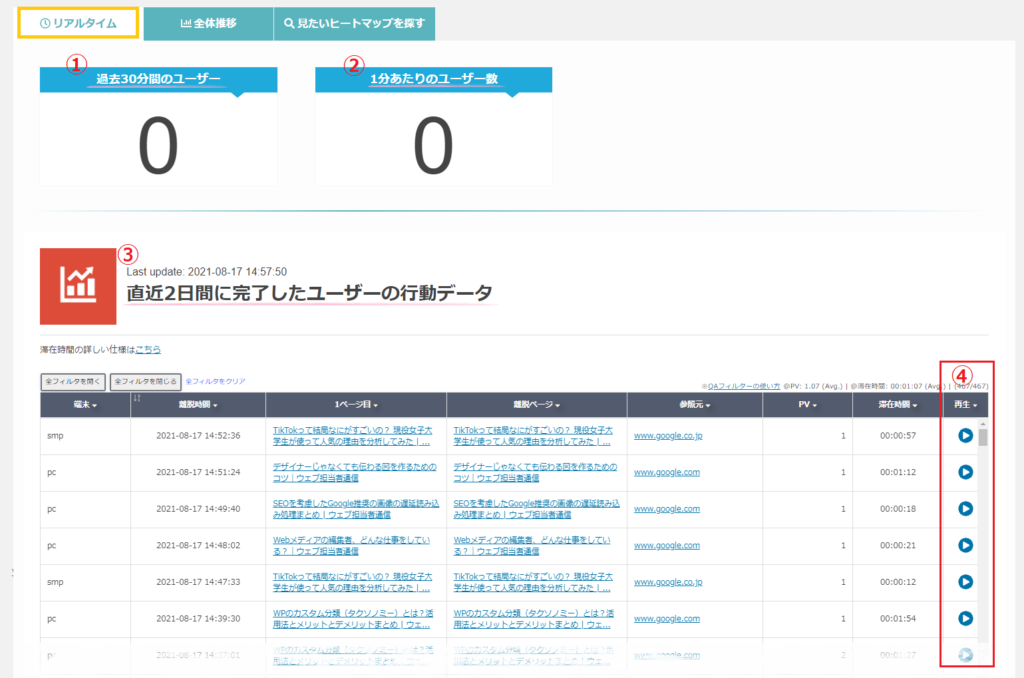
1) Number of users in the past 30 minutes
The table is based on Google Analytics’ App+Web*.
It represents the total number of users who “landed on a page or made a page transition” in the last 30 minutes. When 30 minutes have passed without a page transition, the session is considered complete, and you will be taken to the bottom row of “User behavior data completed in the past two days.
2) Number of users per minute
The table is based on Google Analytics’ App+Web*.
As with the 30 minute count, this is the total number of users who “landed on a page or made a page transition” in the last minute. Therefore, if a user leaves their browser open and goes to Youtube for a minute, they are not counted because they have not done anything on the site.
* App+Web is a new property of Google Analytics.
Currently, Google Analytics has a number similar to the Real Time Report, but it shows the number of active users within 5 minutes (from Google Analytics official help). Therefore, the number of users per minute in QA Heatmap Analytics will always be less than that number. (See here for more information on the differences between Google Analytics and QA Heatmap Analytics.)
3) Data on user actions completed in the last two days
Lists the behavioral data of users who have completed a session within the last two days.
4) Play button
The user’s browsing behavior can be viewed like a movie.
Click the Play button to open the playback window.
◆Overview
You can specify a time period to check the entire access.
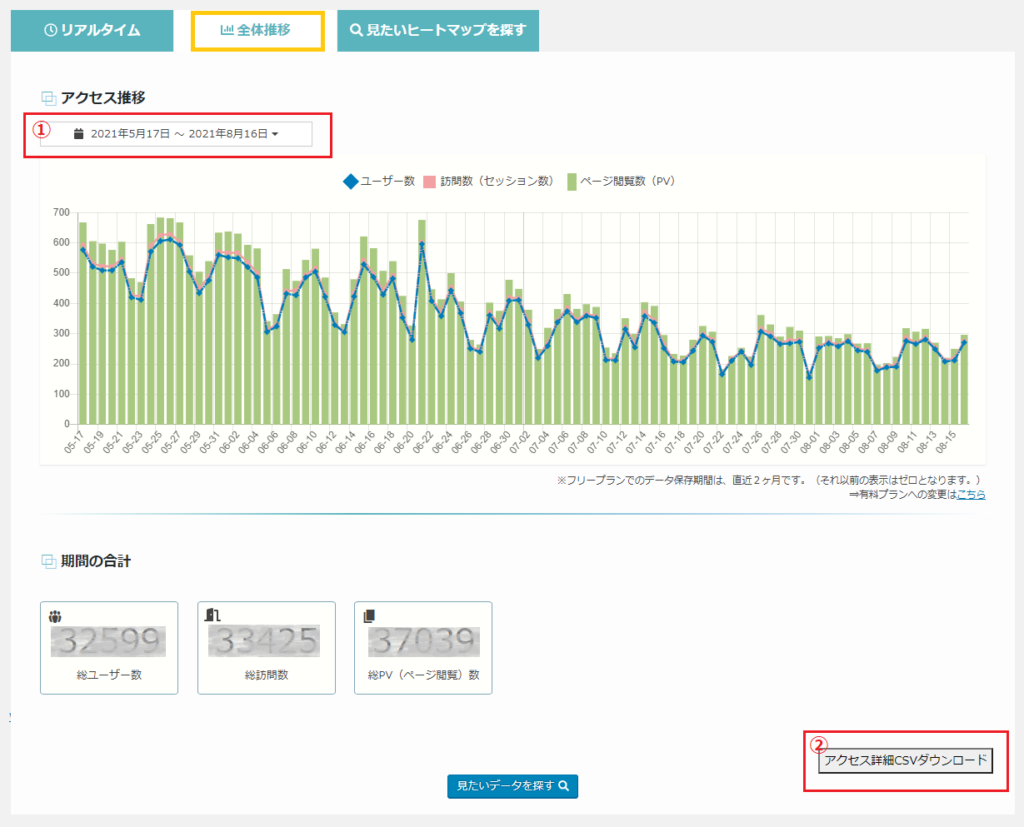
In the first setting, the last three months are shown.
(Picture1)You can change the display period using a calendar or other means.
The selected period will be reflected in the graph, total, and data download period.
*For periods with no data, the numbers will be displayed as “0”.
■Download detailed data
*Since Ver 2.0.5, “CSV” file download has been switched to“TSV” file download. (Changed from comma-separated to tab-separated.)
No more concerns about shifting columns even when “,” (comma) is included in the title.
(Picture2)
In Ver. 2.0.4 and earlier, when you click the “Download Access Details CSV” button, a CSV file (comma separated) will be generated.
In Ver. 2.0.5 and later, when you click the “Download Access Details TSV” button, you will be able to download the access details as a TSV file (tab-delimited).
You can download detailed data. (You cannot select the file type.)
*The CSV file seems to be opened immediately without any special work in Excel, but the TSV file needs to be configured.
((Reference site: How to open a TSV file in Excel))
*Downloading may not be possible depending on the amount of data. In that case, please shorten the specified time period (reduce the total PV of the period) and download.Although it varies depending on the server, it is recommended to set the upper limit at around 10,000 total PVs.
*The file is created when you download it.
・The file name will be “QA_Data_[Period]”.
▼For Ver 2.0.0 (CSV file)
・If the selected period spans multiple months, a file will be created for each month. (You may need to adjust the amount of data.)
Example: If you have selected May 17, 2021 to June 30, 2021.
Two files, QA_Data_20210517-20210531.csv and QA_Data_20210601-20210630.csv, will be created and downloaded.
・Each number in “device_id” represents the following
1 =PC
2 =tablet
3 =Smart phone
▼ For Ver 2.0.2 to Ver 2.0.4 (CSV file)
・Basically, it is created as one file. If the total number of PV for the period is 300,000 or more, a file will be created for each month. (The amount of data may need to be adjusted.)
▼For Ver 2.0.5 or later (TSV file)
・Basically, it is created as one file. If the total number of PV for the period is 300,000 or more, a file will be created for each month. (The amount of data may need to be adjusted.)
◆Sessions & Heatmaps
(Formerly known as “Find the Heat Map You Want to See”)
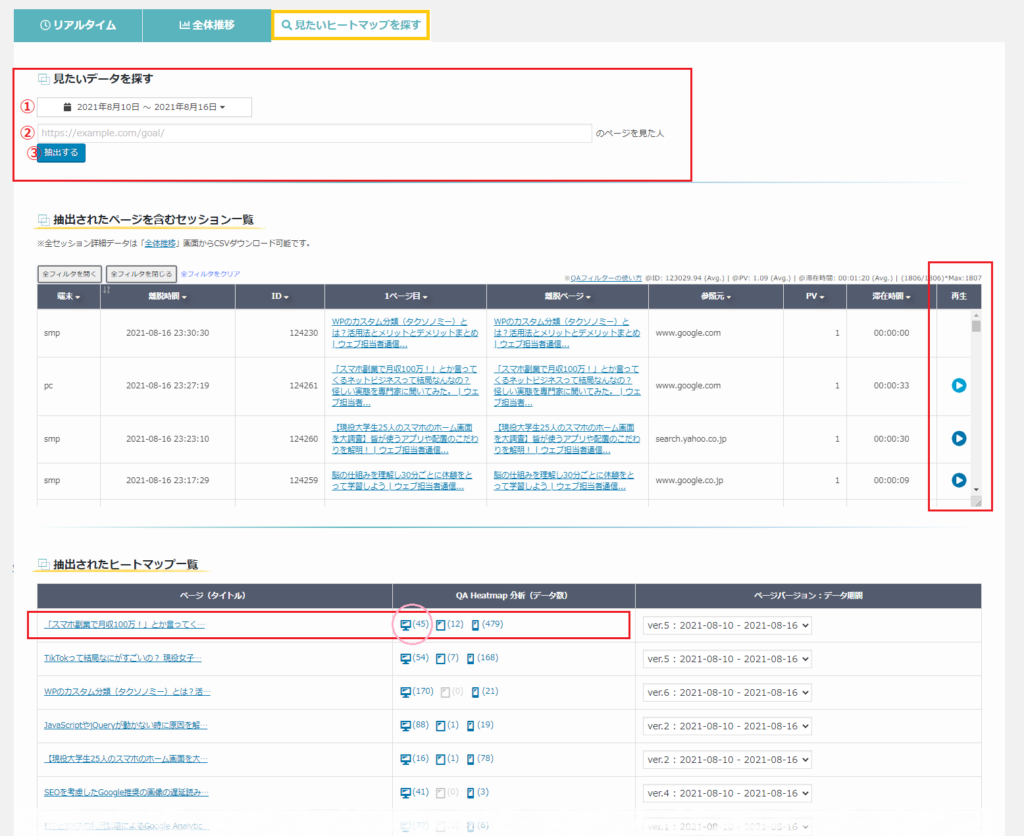
The last 7 days are displayed.
■Find the data you want to see.
You can narrow down the data you want to see here.
1) Specify the period.
2) Enter the URL of the page you want to view.
3) Click “Extract”!
Then, at the bottom, you will see a list of sessions that include that page within that time period, and a list of heatmaps.
■List of sessions that contain the extracted pages
The session containing the extracted pages is displayed.
By clicking the play button, you can watch a movie of the user’s browsing behavior during that session.
QA filters are used to further refine the results.
■List of extracted heatmaps
You can see a heatmap of the extracted pages.
Click on the device icon in each page row to open the heatmap view screen.
*If you want to view heatmaps without restricting the time period, etc., please use “Heatmap Management” as before.
【For those who used the old version (Ver. 1.x)】
*Ver. Starting from 2.0, “Real-time View” and “Site Statistics” have been integrated and reborn with improved functionality.
To change a plugin from Ver 1.x.. to Ver. 2.x.. Due to the nightly processing of the data, the “Overview” and “Session & Heat Map” will not be available on the day of the update. Please wait for the next day.