
* This article was wrote when: Ver 1.1.7.0.
(Last update when: Ver. 2.0.7)
In the heatmap view screen, you can see the heatmap of the measurement page.
(For the method of data calculation, see Heatmap Specifications.)
To open the heatmap viewing screen:
There are two ways to open the viewing screen.
(A) From “Home” screen, “Session & Heatmap” section.
You can narrow down the data, for example, if you want to specify a time period.
Click the “numbers” in the page (title) row; each device column in the list of Heatmaps which found.
(B) From “Heatmap Manager” screen.
For example, if you want a comprehensive data.
Click on the “Device Icon” in the measurement page (title) line.
Heatmap view screen:
– Top menu bar
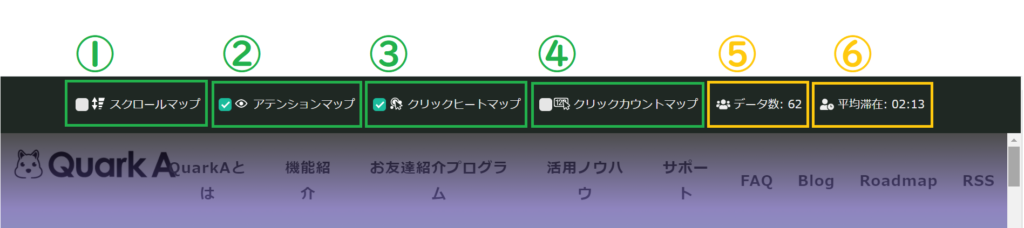
Use the checkbox to turn the map display on or off.
The default settings for (1) and (4) are OFF.
Move the cursor over it to see a detailed description.
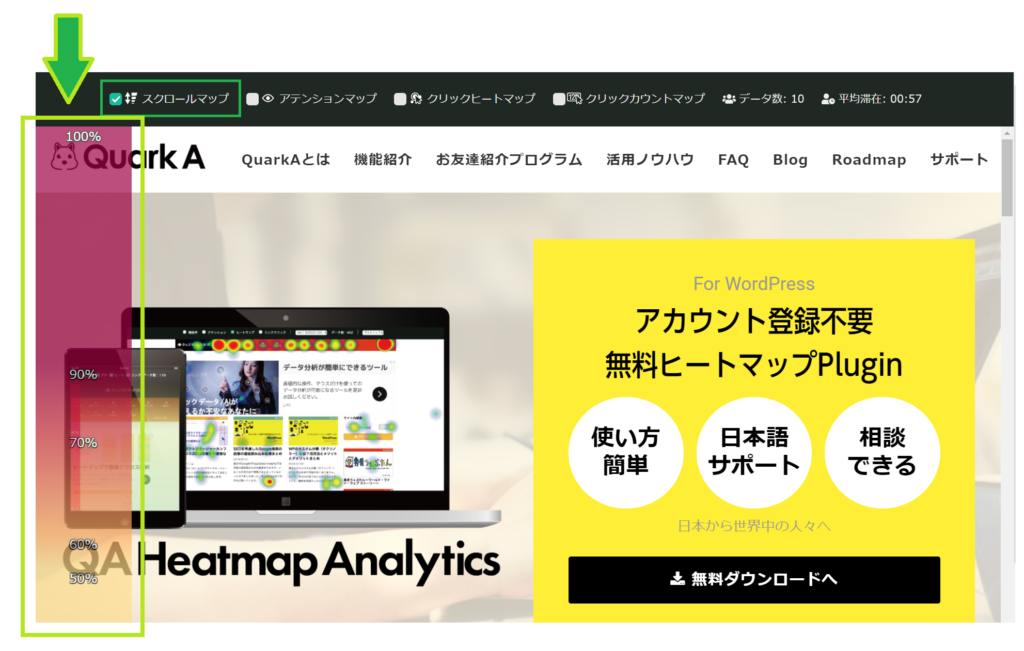
– (1) Scroll Map
It will be displayed on the left side of the screen.
Indicates “What percentage of people read to about what point of the page?” out of those who viewed the measurement page.
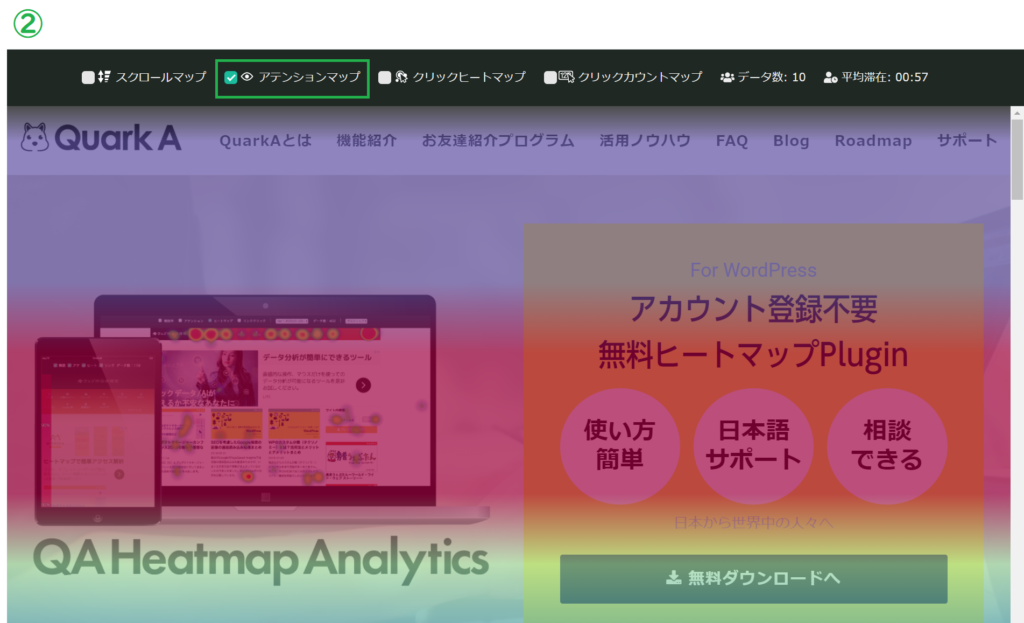
– (2) Attention Map
The more often it is read, the redder the section becomes.
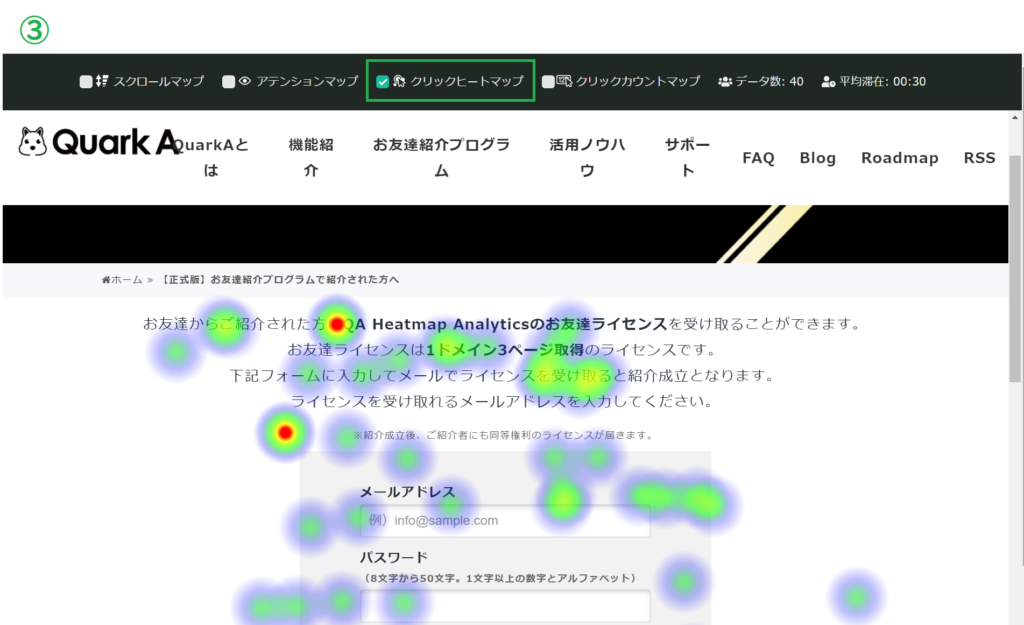
– (3) Click Heatmap
The more clicks you get, the more the area will turn red.
* For the number of clicks on links and buttons, please use (4) Click Count Map.
– (4) Click Count Map
Indicate the specific number of times a banner, button, or link has been pressed.

– (5) Data Amount
It shows the number of data recorded on the measurement page. It can be said to be the number of data that make up the heatmap.
– (6) Average Time on Page
Shows the average time spent per visitor on this page. It is calculated by dividing the total time spent by the number of data. The dwell time covers the time the user was actually viewing the page. It does not include time spent using other applications.
– Related page:
Heatmap Specifications